Survey oF Agvik
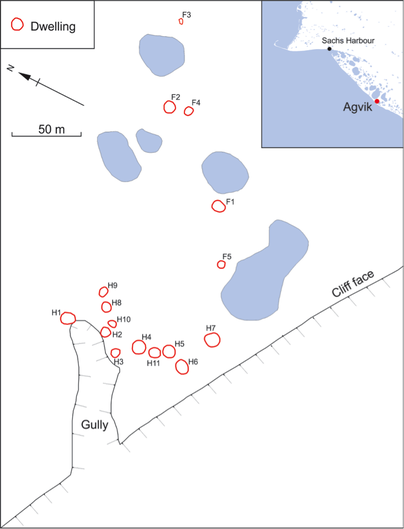
Agvik (OkRn-1) is a Thule-Inuit site on a high bluff next to a large gully, approximately 30 km southeast along the coast from Sachs Harbour. The site includes the remains of at least 14 Thule-Inuit winter houses (Figure 1). The main cluster of 11 houses is near the gully and there are several other mound features further east which also appear to be dwellings (F1, F2, F4 and possibly also F5). Feature 3 is a pile of whale bone. Chuck Arnold conducted some small test excavations at the site in 2009 (Arnold 2010).
The cliff edge at the site is eroding rapidly, and a comparison of our map with Arnold’s from 2009 shows that both the southern edge of the gully and the edge of the bluff have moved several metres between 2009 and 2013. This suggests that Houses 1, 2 and 3, which are closest to the gully, are under serious threat due to erosion, and that House 6, closest to the coast, could also be impacted in the next decade. |
Geophysical Survey Results
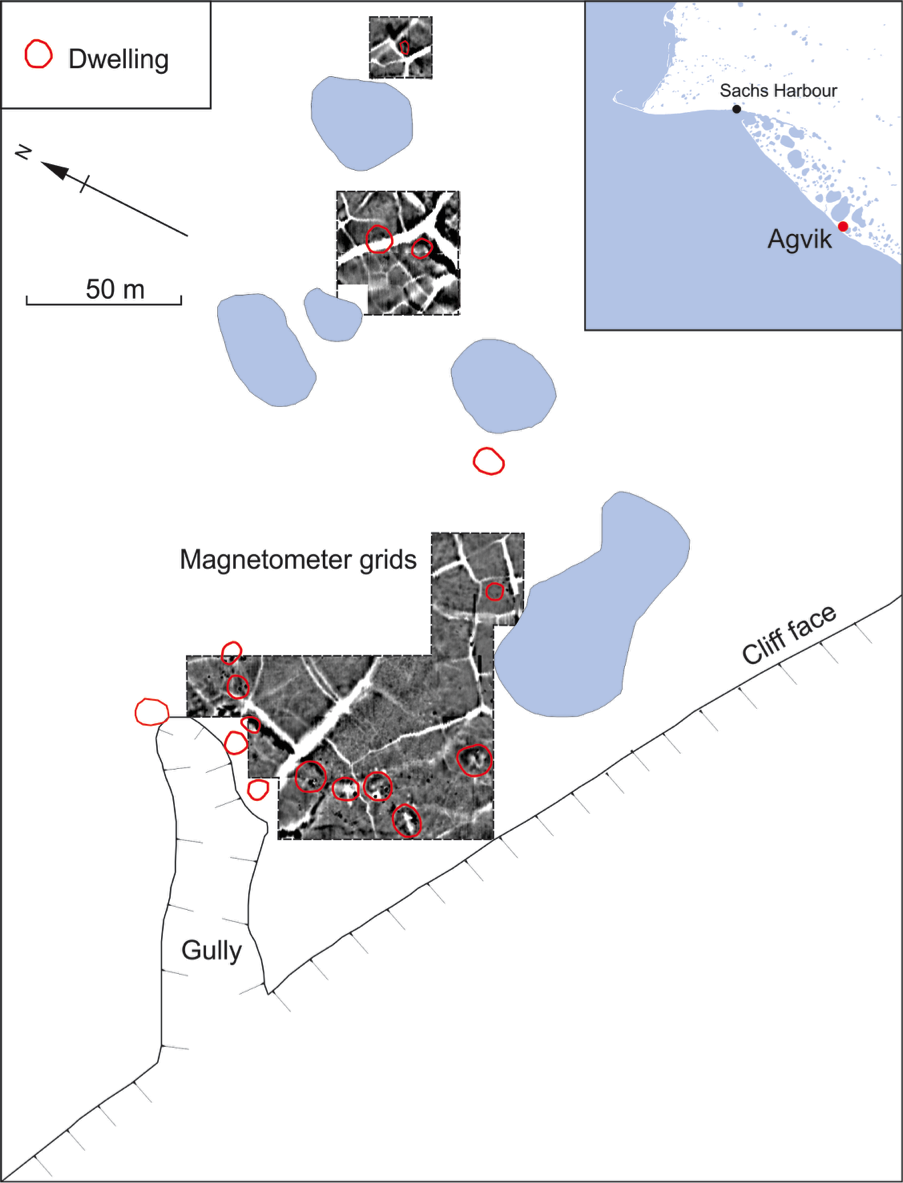
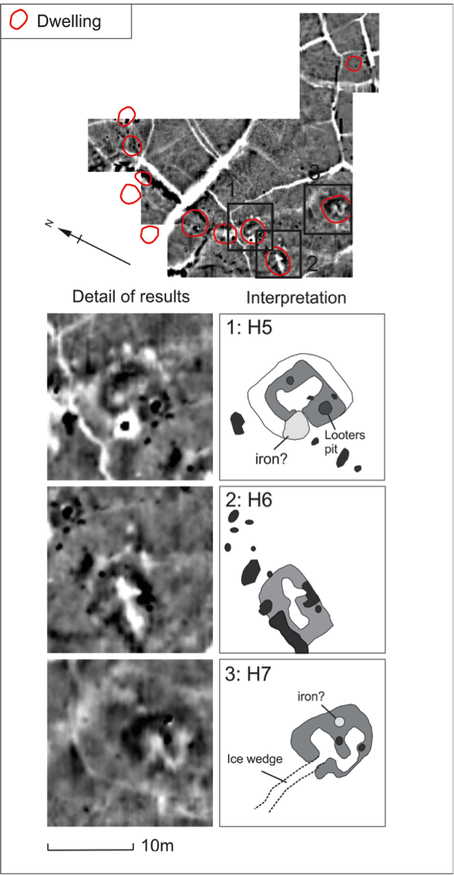
The Agvik magnetometer survey was the most successful of the 2013 field season. The most obvious feature of the survey is the large white lines that criss-cross the site (Figure 2). These are the result of frost features (frost cracks and frost wedges). While these large anomalies “wash out” many parts of the survey area, many of the houses show up clearly. Figure 3 shows details of the main magnetometer survey area for Houses 5, 6 and 7. In each case, the collapsed walls of the dwellings are clearly visible. The irregular shape of these anomalies suggests that the magnetometer may also be picking up some internal structures within the dwellings. House 5 also shows clear evidence of Arnold’s test pit from 2009, which likely contains an iron nail. The large black ovals immediately outside Houses 5 and 6 may be middens (garbage piles) created when the houses were in use.
The Agvik magnetometer survey was the most successful of the 2013 field season. The most obvious feature of the survey is the large white lines that criss-cross the site (Figure 2). These are the result of frost features (frost cracks and frost wedges). While these large anomalies “wash out” many parts of the survey area, many of the houses show up clearly. Figure 3 shows details of the main magnetometer survey area for Houses 5, 6 and 7. In each case, the collapsed walls of the dwellings are clearly visible. The irregular shape of these anomalies suggests that the magnetometer may also be picking up some internal structures within the dwellings. House 5 also shows clear evidence of Arnold’s test pit from 2009, which likely contains an iron nail. The large black ovals immediately outside Houses 5 and 6 may be middens (garbage piles) created when the houses were in use.
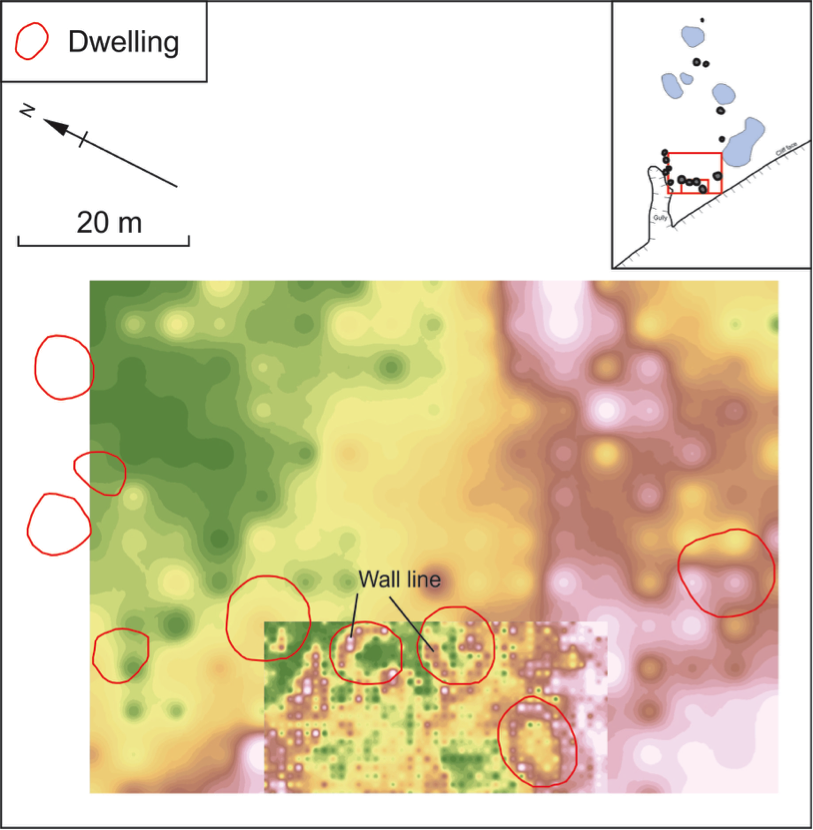
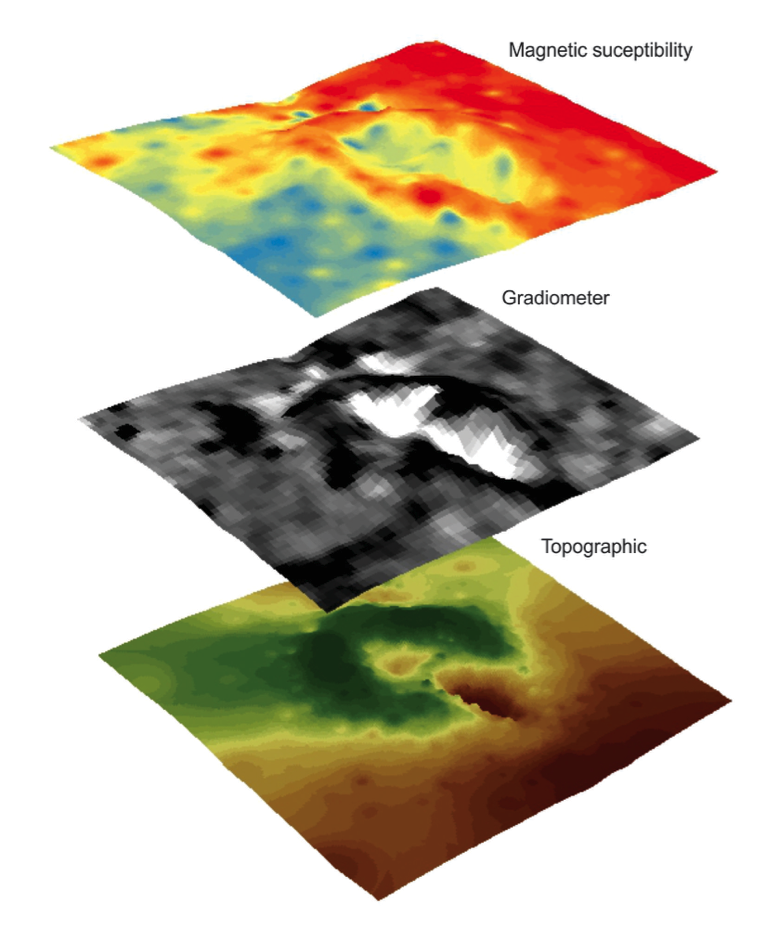
Two magnetic susceptibility surveys were conducted at Agvik, one broad scale survey at 5 m intervals and a second smaller close-interval survey at 1 m intervals (Figure 3). As with the Cape Kellett survey, the broad interval survey provides little information. It shows only a general trend of increasing susceptibility from north to south across the survey area. The close-interval survey, however, showed considerably more promise, picking up the wall lines of all three dwellings to varying degrees (Figure 3). Figure 4 presents the results of the magnetometer and susceptibility surveys draped over a three dimensional representation of House 6. The image clearly shows magnetic highs associated with the walls of the house and magnetic lows associated with the central depression and entrance tunnel. Both the magnetometer and susceptibility surveys also show a magnetic high immediately to the left of the dwelling, which suggests some form of human activity, perhaps a midden (garbage pile). Increasing the number of readings in the magnetic susceptibility survey would provide even better detail.

